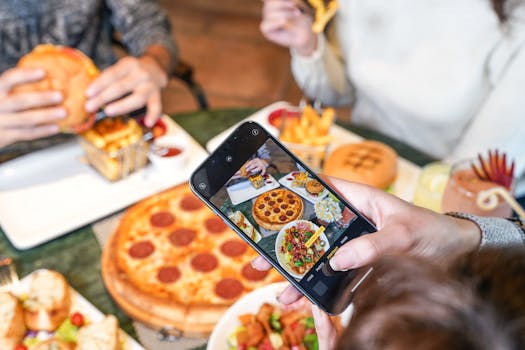
Fast food advertising is everywhere—from billboards to YouTube ads, eye-catching Instagram posts to interactive mobile apps. Yet, with billions spent globally each year, how do brands know if their campaigns are actually working? The secret lies not just in creativity, but in measurement. In an increasingly data-driven world, understanding exactly how to measure the success of fast food advertising campaigns is essential for brands to stay competitive and maximize return on investment (ROI).
This article explores the key performance indicators (KPIs), advanced techniques, and tools that allow marketers to truly gauge the effectiveness of their advertising efforts in the fast food industry. Whether you’re a marketing professional, a franchise owner, or simply curious about what makes a campaign a winner, read on to discover how success is measured and why it matters more than ever.
The Importance of Measuring Fast Food Advertising Success
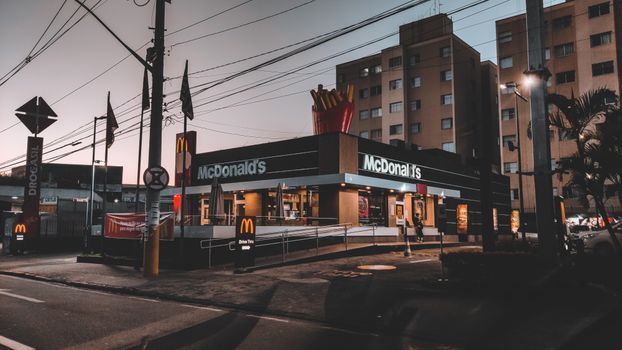
Advertising is a significant investment for fast food brands. In the United States alone, the fast food industry spent an estimated $5.1 billion on advertising in 2022, according to Statista. With such high stakes, brands must ensure their campaigns are delivering clear, measurable results that justify their spending.
.png)
Measuring campaign success helps brands:
- Allocate budgets more effectively - Identify which channels and messages resonate with their audience - Adjust strategies in real-time to optimize results - Maintain a competitive edge in a crowded marketWithout robust measurement, even the most creative campaign risks falling flat, delivering minimal impact on sales or brand perception.
Key Performance Indicators for Fast Food Advertising
To measure success, brands need clear metrics. While metrics may vary depending on campaign goals, the following KPIs are commonly tracked in the fast food industry:
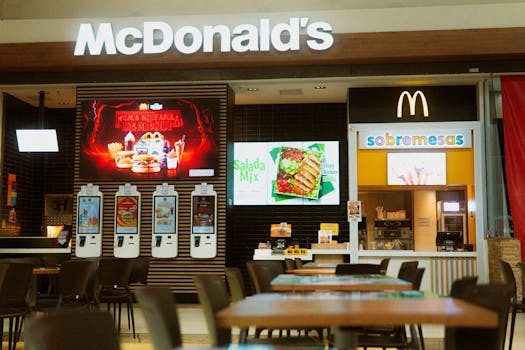
1. Sales Lift: This is perhaps the most direct indicator. Did the campaign lead to a noticeable increase in sales during and after the advertising period? For example, McDonald’s reported a 7% increase in U.S. same-store sales in Q2 2023, partially attributed to successful new menu item campaigns. 2. Foot Traffic: Fast food is about convenience and proximity. Brands use location data and mobile analytics to track increases in store visits following a campaign. 3. Digital Engagement: Metrics such as click-through rates (CTR), video views, likes, shares, and comments help gauge how well digital campaigns resonate with the target audience. 4. Brand Awareness & Sentiment: Surveys, social listening tools, and brand tracking studies measure shifts in public perception and awareness after a campaign airs. 5. App Downloads & Loyalty Signups: With the rise of mobile ordering, tracking new app downloads or loyalty program signups is crucial for digital-focused campaigns.Tools and Technologies for Measurement
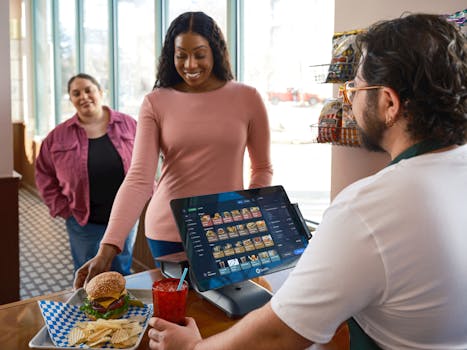
The fast food industry leverages a variety of tools and technologies to track and analyze campaign effectiveness:
- Point-of-Sale (POS) Data: By analyzing transaction data before, during, and after a campaign, brands can accurately attribute sales changes to specific ads. - Mobile Location Analytics: Tools like Placer.ai or Foursquare help track real-world foot traffic increases to specific restaurant locations. - Social Media Analytics Platforms: Services such as Sprout Social and Brandwatch provide real-time insights into digital engagement and brand sentiment. - Attribution Platforms: Solutions like Google Analytics and Adobe Analytics allow marketers to assign credit to different channels and touchpoints, showing which ads drove conversions. - Customer Surveys: Direct feedback helps measure brand awareness, ad recall, and customer sentiment post-campaign.Comparing Traditional and Digital Campaign Measurement
As advertising channels proliferate, measurement strategies have evolved. Traditional channels like TV and radio require different analysis methods than digital platforms. The table below highlights the key differences:
| Measurement Aspect | Traditional Campaigns | Digital Campaigns |
|---|---|---|
| Impression Tracking | Estimated via ratings, reach, or surveys | Precisely tracked in real-time |
| Sales Attribution | Challenging; often relies on pre/post sales analysis | Direct, using unique links, codes, or app data |
| Engagement Metrics | Limited (e.g., phone-ins, coupon redemptions) | Rich metrics: clicks, shares, comments, video views |
| Cost Efficiency | Higher cost per impression; less granular | Lower cost per action; highly targeted |
| Adjustment Speed | Slow—requires campaign pause or new creative | Immediate; changes can be made in real-time |
This comparison explains why digital measurement methods have become increasingly important, especially as consumer behavior shifts toward mobile and online platforms.
Advanced Techniques: Multi-Touch Attribution and A/B Testing
Modern campaigns rarely rely on a single channel. Customers might see a TV ad, then receive a mobile coupon, and finally complete an order via an app. Measuring the true impact of each touchpoint is complex. Here’s how advanced techniques help:
Multi-Touch Attribution Multi-touch attribution assigns value to every interaction a customer has before making a purchase. For example, a customer might see a Facebook ad, receive a promotional email, and then visit the restaurant. Multi-touch attribution models, such as linear or time decay, help brands understand which channels and messages are most influential.
A/B Testing A/B testing involves running two versions of an ad or campaign element (such as a headline or image) to see which performs better. In the fast food industry, this might mean testing two different offers (e.g., free fries vs. 10% off) in different markets, then measuring which generates more redemptions or sales. According to Google, brands that use A/B testing can boost conversion rates by up to 49%.
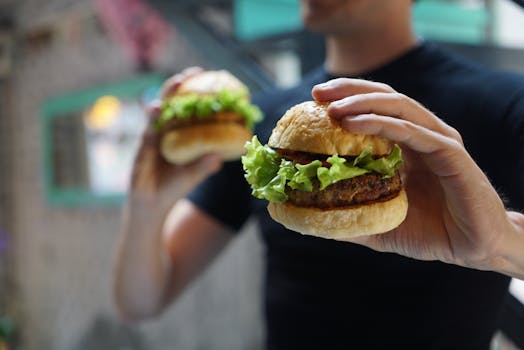
Case Study: Measuring Success of a Limited-Time Offer
Let’s consider a real-world example. In 2022, a national fast food chain launched a month-long “Spicy Chicken Sandwich” campaign across TV, digital, and social channels. Here’s how they measured success:
1. Sales Data: POS systems tracked a 12% increase in chicken sandwich sales during the campaign versus the previous month. 2. Foot Traffic: Mobile location analytics showed a 9% rise in in-store visits for participating locations. 3. Social Media: The hashtag #SpicyWin was used 25,000 times, with a 30% increase in positive brand sentiment. 4. App Engagement: 18,000 new loyalty signups were directly attributed to exclusive app offers.By triangulating these data points, the brand not only confirmed the campaign’s effectiveness but also identified the most impactful channels for future promotions.
Challenges and Considerations in Campaign Measurement
Despite advances in technology and analytics, brands still face challenges when measuring fast food advertising success:
- Attribution Complexity: It’s increasingly difficult to isolate the effect of a single campaign in a multi-channel world. - Data Privacy: As regulations tighten, brands must ensure compliance when collecting and analyzing customer data. - Lagging Indicators: Some metrics, such as brand perception, may take weeks or months to show meaningful change. - External Factors: Weather, economic shifts, or competitor actions can influence campaign results, complicating analysis.Brands must adopt a holistic approach, blending quantitative data with qualitative insights to get a true picture of campaign effectiveness.
Final Thoughts: Making Fast Food Advertising Measurement Work
Effectively measuring the success of fast food advertising campaigns is both an art and a science. It requires a blend of robust data collection, advanced analytical tools, and a willingness to adapt based on insights. As digital platforms become the new battleground for customer attention, the ability to accurately track and respond to campaign performance will determine which brands thrive.
By focusing on the right KPIs, leveraging modern technology, and remaining agile in strategy, fast food marketers can ensure their advertising dollars are spent wisely—and that their next campaign is even more successful than the last.